Now that we have most of our assumptions in place, the fun begins. We can start modifying our assumptions that drive sales revenue or fixed costs that will begin to calculate net operating income.
When we forecast an income statement all of these variables work in tandem to support our net operating income formula. Once we line net operating income up with our assumptions, we can move the conversation with potential investors toward what the assumptions are versus debating the whole income statement.
How to Wrap up Income Statements Easily
We've already captured most of our indirect costs, capital expenditures, and other costs incurred within our Fixed Items and Assumptions, so most of the work is done already. We can calculate net income by simply inserting our assumptions into the respective tabs, so we'll walk through those tabs in the income statement to make sure we don't miss anything.
Here’s what we’re going to work on:
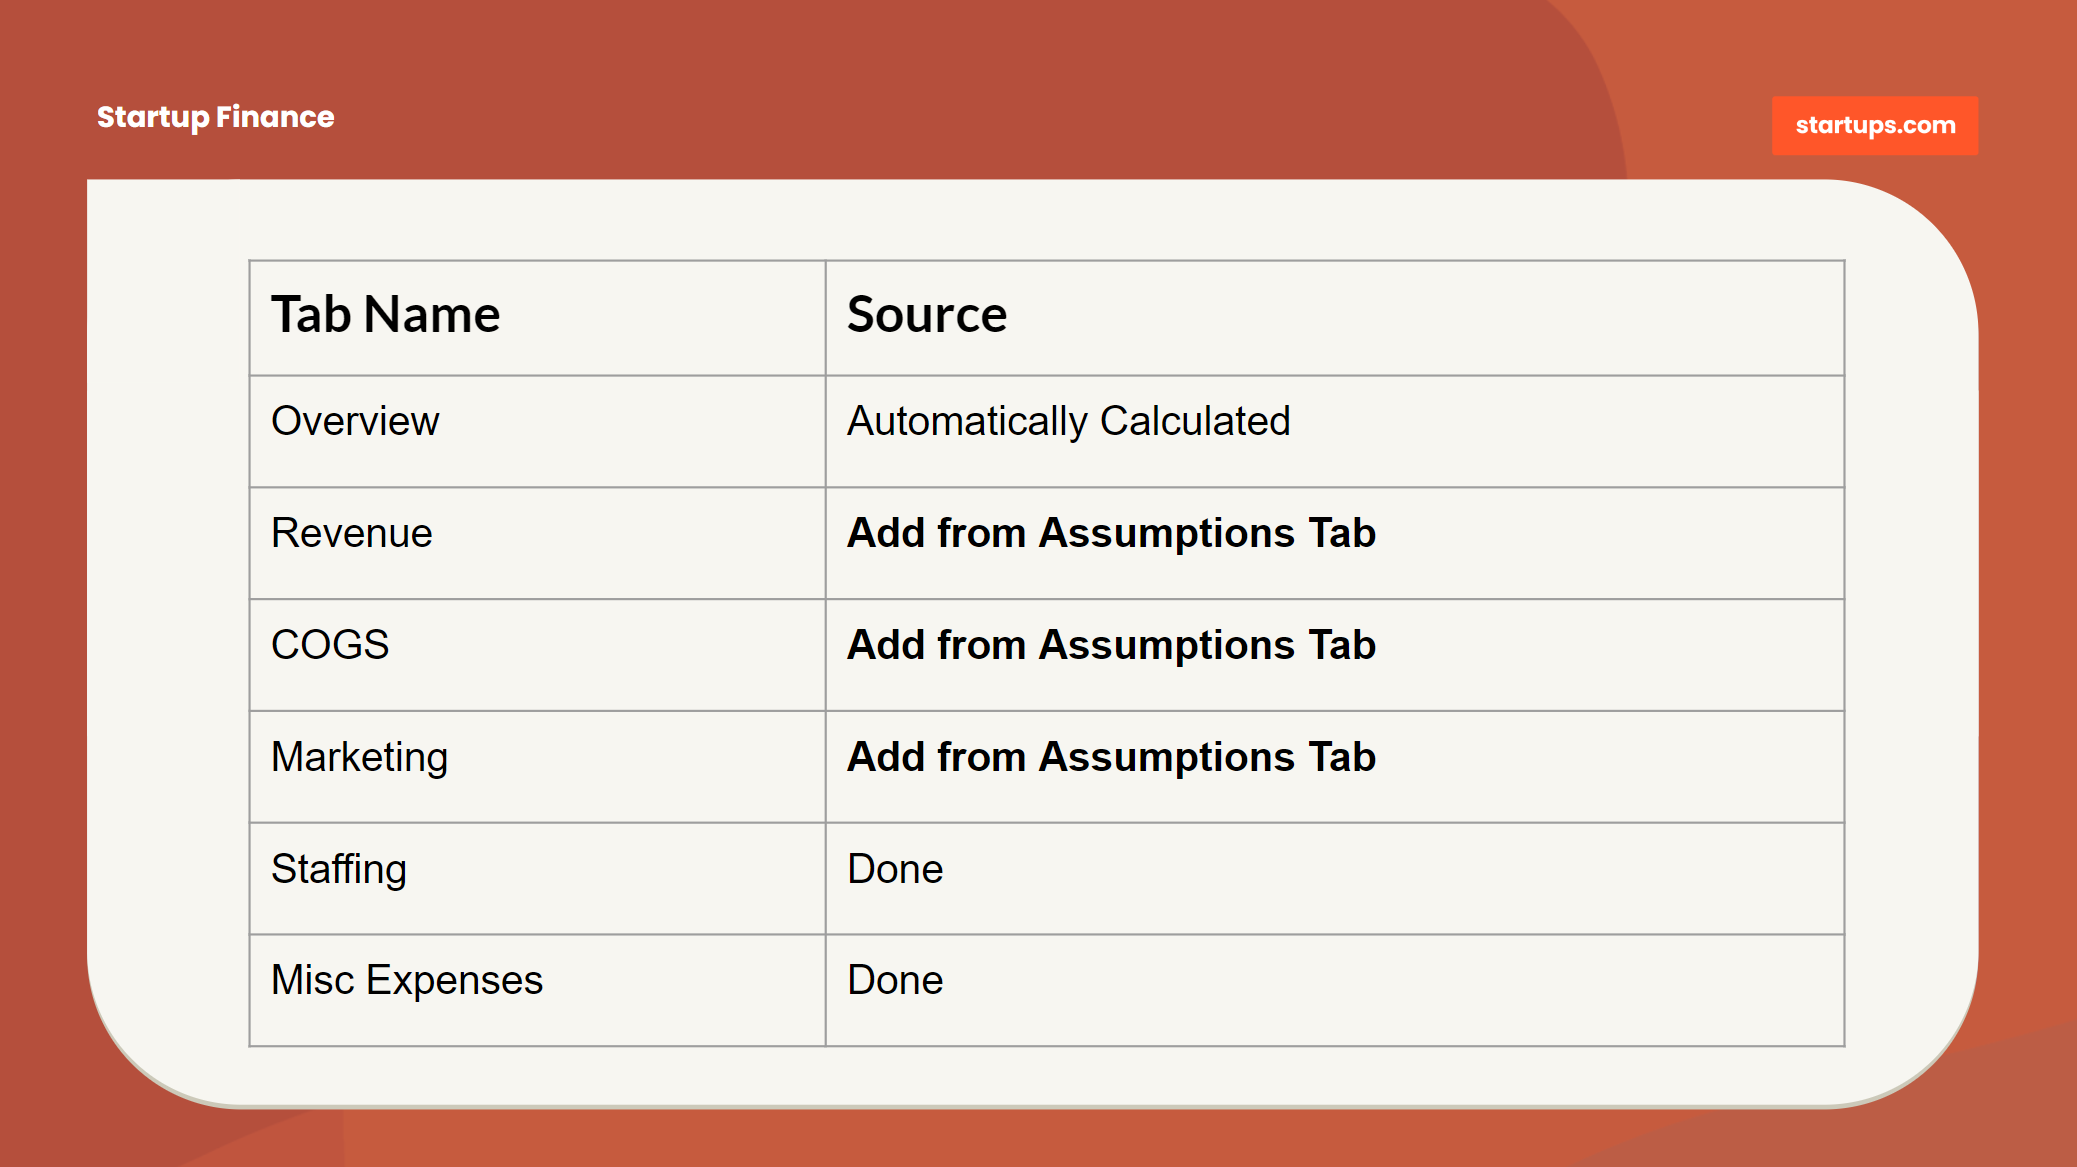
Let’s start with the “Revenue” tab and then work our way back toward the “Overview” tab which is automatically calculated from all of our other tab inputs.
Revenue
The Revenue tab includes multiple sources of revenue – Credit Cards, Checks, and “Other Sources.” We may not use credit cards or collect checks, so those are there just in case we use multiple forms of payment. In the event that our business only uses one form, feel free to populate the revenue projections in that line item and delete the others.

Ideally, we are pulling our revenue estimates from the Assumptions tab that we worked on earlier. To be fair, some businesses may not be able to utilize the Assumptions tab very effectively to drive forecasts, and therefore are going to need to default to a more traditional method of forecasting which involves making estimates per month. That’s OK, it’s just a bit less metric driven.
Total Revenue
In our Assumptions tab, we calculated both New and (if relevant) Recurring Revenue for each month. Our next step will be to use those values in our Revenue tab under the appropriate income source – Credit Cards, Checks, or “Other Sources.”
If some revenue will come from credit cards and other revenue from checks, and we’re not sure which to add them to, default to Credit Cards as a single place to add them.
That’s because Credit Cards involve Processing Fees as well as a provision for Refunds and Chargebacks that will lower the overall revenue.

What about Checks?
In the event that some of this revenue is generated via Check, which does not impose a credit card processing fee, then we will be a little bit ahead. It’s better to err on the side of caution here than to have up to 5% or more of our income get caught up in expenses we didn’t plan for.
The next step is to insert the values of “Total Revenue” from the Assumptions tab into the “Income (Credits)” row of “Credit Card Revenue” or the “Total of Checks” row of “Checks Received.”
If we’re only going to use one category, then just make sure to use a “0” value for any other income sources.
Refunds and Chargebacks
If we’re processing via Credit Cards, we’re likely going to be dealing with both Refunds and Chargebacks. The income statement provided has a variable set for both items.
Refunds are set to 3% (see yellow variable box)
Chargebacks are set to 1% (see yellow variable box)
There is no specific rule for those values, and really, we won’t know what to use until we’ve processed enough transactions and can start to manage toward a trend. These are most helpful to create projected line items so that we have some provision for potential losses.
Checks Received
The same provision is set for Checks Received whereby the 1% value can be adjusted to reflect actual refund trends once we get a better feel for them. If we find that we need to include yet another line item for refunds, we can add another row below “Other Sources” as well.
At this point, we can adjust the percentage variables for Refunds and Chargebacks or leave them as is until enough data is gathered to adjust them further.
Forecasting without Assumptions
As we mentioned earlier, it may also be the case that the Assumption worksheet isn’t helpful in driving the revenue forecast and we may have to default to a more manual method. That’s fine. In that method, we’ll still want to establish some basis for what might drive sales in each month.
This may include a traditional sales forecasting cycle that looks at sales opportunities (typical in longer sales cycles) and potential close dates and then factors a “close percentage” that determines the number of deals that will go through.
There’s no hard and fast rule here, but the closer we can get to use some isolated assumptions and metrics, the easier it will be to develop our plan, and if need be, defend it to folks like investors when raising capital.
Cost of Goods Sold (COGS)
Since our assumptions sheet is SaaS focused, we will need to handle COGS in its own tab. Remember, COGS are important if we sell (typically) physical goods — furniture, clothing, appliances, etc.
Our assumptions for the COGS tab will include direct costs and variable costs. Direct costs are the costs associated with each specific unit of production.

Cost of Goods Sold Example
For example, if we sell bicycles then our direct costs for the bike would be a metal frame, tires, spokes, bell, and brake cable. Let’s assume that the metal frame of the bike costs us $80 per bike. That's simple enough — we are matching direct input costs with units sold.
If the tires, spokes, and brake cable cost another $100 per bike then our total direct costs per bike would be $180. If we sell 100 bikes per month then the total direct costs would be $180*100 or $18,000.
As a result, when doing our monthly assumptions for COGS it is critical to project units sold and the cost to make those units. If it costs us $180 to produce a bike, but we are selling it for $160 then that’s probably a problem! We'd need to adjust our gross operating income quite a bit!
Indirect Costs
However, things can get a bit more complicated when we have production costs not directly related to any one unit. For instance, we may rent a production facility for $1,000 per month.
This cost is not directly tied to any one unit, but it still needs to be accounted for in the cost of goods sold. Without the production facility, we would not be able to produce bikes - hence just as important as the raw materials to produce a metal frame or rubber tires.
This same rationale applies to all facility costs (rent, mortgage, property taxes), salaries of facility maintenance personnel, production manager's salary, wages of manufacturing labor, supplies for the production facility, and utilities.
These expenditures per month should be factored into our COGS tab. If we know rent will be $1,000 per month for the next 24 months we can forecast this cost out — same with salaries.
Total Costs of Small Items
Some supplies for the production facility could include inputs that are too difficult to attribute to any one unit of production. For example, if we use $200 per month of glue to paste our logo to the bike frame that would be input as its own cost in the COGS tab. Rather than trying to calculate the cost of each drop of glue per bike.
Marketing
Our marketing forecasts will be a bit of a hybrid between our Assumptions and actual financials. That’s because our marketing and customer acquisition may not be entirely tied to money. Many of our marketing channels, including word of mouth, email, press mentions, and social media may have little or no cost attached to them at all.
Our Assumptions tab only calculates the number of visitors that our channels will draw and what respective budget might drive that activity.
The detailed values of which channels will drive traffic and what those relative costs are actually originating from the Marketing Plan, not the Income Statement.
Total Cost of Marketing
In order to capture our marketing estimates, we’re going to have to determine which elements of our Marketing Plan will translate to the timing of cost on our financial plan.
In the event that we don’t have a Marketing Plan then our next best option would be to use the whole dollar amounts of our “Budget” under “Customer Acquisition Costs” in the Assumptions tab and either add them into a single line item in the Marketing tab under whatever category feels most appropriate.
If we’re more enterprising and actually have a Marketing Plan, then we can layer in each of the cost estimates per channel into the appropriate categories. As always, it’s OK if we’re not 100% accurate as to which channel we’re going to spend in for any given month – so long as we recognize that the total outlay of marketing will generate something close to our revenue projections.
Right now we can choose to either enter a whole value for marketing spend or use a more detailed layout of marketing spend if we have specific channels that we have forecasted for. Remember that these are forecasted placeholders that we will ultimately swap out for actual spend values as each month ensues.
We’re not concerned about which category we spend in — we’re concerned about the “Total Marketing Costs” line item at the bottom of this tab.
Overview (AKA The “Big Show”)
Alright friends, we have finally arrived at the “Big Show” — the Overview Tab. Great news — there is nothing to input here! All work is auto-magically done by the spreadsheet calculations. All we need to do now is sit back and let the money tumble in.
And by “sit back” I mean work nonstop. And by “let the money tumble in” I mean pray for profit.
If we’ve done our jobs right, all of our tabs should roll up into this fancy forecast that becomes the epicenter for all of our financial focus. When someone asks, “Are you making any money?” they are essentially asking us what the “Net Operating Income” line of this document says. If it’s a positive number — we win. If it’s negative, well, we know how that story goes.
Let’s do a quick run-through of the Overview just to make sure we understand the calculations and perhaps make some edits if we messed anything up.
Revenue
Our Revenue line item is going to be a combination of all of our forms of income, minus a couple “expenses” baked in if we have refunds or chargebacks. So what we’re seeing in the “Revenue” line is our income with Refunds and Chargebacks already subtracted.
COGS (Cost of Goods Sold)
The Overview tab doesn’t display any detail for COGS simply because many businesses have fairly complicated details to display them all at once. That said, if there are a couple major COGS that we want to track, such as labor or unit costs, feel free to add a few line items here to display them as well.
Marketing
Our Marketing budgets will be listed by default as a split between online and offline as well as the catch-all for “other.” If we find that we’re only doing online marketing, we can remove the “Offline Channels” line item to keep the Overview tab tidy.
Payroll & Staffing
We rarely see changes to this category in that almost every company has a combination of staff and contract labor and needs to keep a line of sight on Payroll Taxes. The only exception is lack of benefits provision which can be removed if it’s not applicable.
Office Operations
We’d be hard-pressed to make many changes here as nearly every business will have some level of activity across these categories. At most, if the business is really small right now, we can probably roll-up “Office Services” and “Subscription Services” into a single category.
Total Operating Expenses
This is simply a calculation of COGS, Marketing, Payroll & Staffing, and Office Operations so that we can get a full view of how much it costs to run our business.
Net Operating Income
Revenue minus Total Operating Expenses = Profit (or loss). Maybe the single most important calculation in all of business! This is the number we will be constantly working toward improving.
Each of these categories represents all we need to know in order to work with and manage our forecasts! What we will learn in short order is that a million little tweaks to every category will have a powerful effect on how we manage the business to break even and someday (gasp!) – PROFIT!

Summary
Forecasting isn’t a one-time thing, especially for startups. We should be updating this forecast constantly as we get more and more data about how our business will perform.
At Startups.com we update our forecasts daily not just because our CEO is a maniac, but because we are very diligent about every detail of our business!
It’s not uncommon for a first-year startup to be constantly adjusting the numbers and watching the forecasts swing all over the place on a regular basis.
To the extent possible, it’s also helpful to share this document with as many management and team members as possible, so that everyone can understand the push/pull relationship that each department has with the other. The Engineering Team may want to hire a bunch of new developers but if the
The marketing team is falling behind on their numbers (which has an effect on Revenue) and capital may not be available. The better equipped the entire team is with the mechanics of the Income Statement, the better they can work together to make key decisions in unison.
At this point, we have all that we need to build and adjust our financial forecasts. The next step is going to be replacing our forecasts with actual numbers as each month progresses. To do that, we’re going to learn how to turn this forecasted income statement into an actual accounting income statement.
Find this article helpful?
This is just a small sample! Register to unlock our in-depth courses, hundreds of video courses, and a library of playbooks and articles to grow your startup fast. Let us Let us show you!
Submission confirms agreement to our Terms of Service and Privacy Policy.