Startup Financial Assumptions
What key assumptions drive our financial forecasts and how do we adjust them to create a financial model that works? Find out all of that below in this article.
October 12th, 2022 | By: Wil Schroter | Tags: Funding
All startup financial projections are based on a few key assumptions about how we feel the business will perform.
In this section, we're going to explain what key assumptions drive our financial forecasts and how to adjust them to create a financial model that works.

Download our Income Statement Template here to get started and follow along.
What’s the Goal Here?
The Assumptions tab in our income statement template gives us a worksheet to help determine what the right values will be to populate in our projected income statement. The tab itself is just a worksheet that drives things like our revenue projections, cost assumptions, and ultimately net income.
We’ll walk through each of the assumptions in this worksheet one by one to give a little more guidance as to how to tackle each one, so don’t sweat it if it seems like a lot. We’ll make it easy.
Assumption 1: Customer Acquisition Costs
We really can’t predict any of our revenue drivers until we have a handle on how many customers are going to come through the door. And in order to drive customers, we must know what we’re going to do to drive them. The cost assumptions based on customer acquisition are some of the most important financial assumptions we'll make in our business plan and typically represents one of the largest startup expenses.
Note that in these examples we use “visitor” to mean anyone coming to buy from us, whether it’s to our website or to our storefront.
We’ll split our customer acquisition estimates into two numbers: Paid and Organic.
Paid Visitor
People we specifically paid money to acquire through some version of paid marketing. This is typically for things like Google Adwords, Facebook Ads, or offline media. This could also include deliberate spending for leads that could then be converted to paid customers.
Organic Visitor
This is everyone we didn’t directly pay for, such as word of mouth, email, referrals, search engine traffic, or people just walking by the store.
Within these two categories, we can do far more to predict our Paid Visitor numbers than our Organic Visitor numbers because there’s typically some type of cause-and-effect relationship between how much we spend versus how many visitors we get, especially with online spending.
When we try to do the same for Organic Visitors, it gets a bit trickier, but we’ll take a look at both avenues to understand more.
Paid Visitor Assumptions
Budget
We’ll begin by starting with a paid media budget. Our example shows a “$1,000” budget that will begin driving all the assumptions around paid visitors. We can use any budget amount we want (or none at all - $0) to calculate the paid number of visitors.
Cost Per Visitor
Our budget will drive a set number of visitors to our site/store. If we know the cost for a visitor (sometimes referred to as “Cost Per Click” in online ad spend terms) we can enter that here.
If we don’t, we can use the best guess and then go back and adjust this later. The Cost Per Visitor value will become extremely important long term as we develop our paid marketing efforts and scale our efforts to acquire customers.
Total Paid Visitors
This is just a calculation – Our Budget divided by the Cost Per Visitor which drives 2,000 “Total Paid Visitors.”
Interestingly if we don’t quite know our “Cost Per Visitor” in the early days, we can often just take the number of visitors we got last month and divide that by our Budget to determine our Cost Per Visitor. It works the same both ways.
That covers our needs on the Paid Visitor side of the calculations. If we are spending across multiple channels (such as Google Adwords and Facebook) we can blend these calculations if we’d like to get the total visitors from all channels.
Organic Visitor Assumptions
Notice that in this line item we have a single line “Total Organic Visitors”. We’re not using additional criteria here because there is no cost basis for our organic visitors. However, that doesn’t mean organic visitors aren’t important! They are incredibly important.
The more organic visitors (read: free visitors) we can attract, the more our “Blended Acquisition Costs” — which is the cost for all of our visitors when we combine both Paid and Organic — goes down. This is the Holy Grail of marketing!
However, we don’t have quite as specific a calculation for how many organic visitors we will drive, simply because we’re not paying for customers to visit us (unlike Paid).
Therefore, the recommendation here would be to use a “best estimate” (read: guess) and start to learn as time progresses how much organic traffic actually comes through the door.
What’s most important to note now is that our Customer Acquisition Costs are a blend of Paid and Organic visitors, and the combination of paid and free customers will have dramatic effects on our bottom line.
Total ALL Visitors
This line item is a calculation summing up the “Total Paid Visitors” with “Total Organic Visitors.” There’s nothing to do here other than making note that this number (and growing it) will basically consume our lives in the near term!
Assumption 2: Conversion Rate
Our “Conversion Rate” is the rate at which “Visitors” (any type) turn into “Paid Customers.”
In the early days, we won’t know what this conversion rate is. Not only that, we’ll find it probably varies dramatically per marketing channel.
We may find that 20% of the visitors we get from our newsletter convert to paid customers while only 2% of our Facebook ad customers pay us.
In this case, we have two very different sets of numbers: the amount of conversion by marketing channel and the amount of conversion from all of our traffic.
Both are incredibly important to track, but more importantly, we have to make sure we don’t project one set of numbers (like our 20% conversion rate on email) to be the same for ALL of our numbers (like Paid Marketing, SEO, or Referrals).
FOOD FOR THOUGHT
A quick aside that is based on nothing but a couple of decades of marketing experience from this grizzled old author – the numbers that we see in the early days are often much better than they are when we scale up a bit.
That’s often because early on the only people finding us are super high-intent buyers (so they convert really well) or people that we have some relationship with.
Over time, as we move from “friendly customers” to “totally random customers” our conversion rates will naturally go downward. Like anything, our mileage may vary.
There’s no way we could possibly know our conversion rate at this very minute. Like all of these stats, we simply have to use the best guess and tune that number over time.
I tend to use numbers in the 3-5% range as more of a “worst-case scenario” but frankly these numbers will swing all over the place until we have enough data that starts to form a trend.
Also worth noting – it’s OK for these numbers to change and it’s definitely OK to be wrong about them. What matters when we’re doing our initial forecasts is just that we understand how these numbers push/pull at each other.
We can see that if we double our “Conversion Rate” our Gross Margins jump quickly. All of this is super important as we begin to learn the semantics of our business model.
Assumption 3: Order Value (New Revenue)
Earlier we spent some time talking about how we can think about Lifetime Value (LTV), which we may recall is the total amount of revenue a single customer will generate.
LTVs are great to use when forecasting the profitability of a single customer or specific costs like marketing. If we spent $100 in marketing to acquire a customer that would ultimately spend $500 with us we could show that as a profitable spend.
But using LTVs in our actual income statement won’t be terribly useful. That’s because, in our income statement, we’re showing how much actual revenue our business generated in a given month.
That’s great that our lifetime value for a customer may generate income in a few months or through until next year, but we need to know how much revenue we will generate each month.
Depending on our business model, we can choose to forecast our revenues using “One-time activity” or if we also have recurring revenue, we may also use “Recurring Revenue” in our revenue forecasting.
One-time activity
We capture the value of the order each time we receive it. This is good for businesses that typically don’t have a monthly recurring component (unlike subscription businesses).
Each month our revenue is tied to the performance of that particular month – if we sell $200 worth of hot dogs this month, our revenue is simply $200. The sample income statement here makes this easy by multiplying the “Total Number of Paid Customers” by the “Average Order Value”.
Recurring Revenue
Revenue forecasting for recurring or subscription-type businesses the model works a bit differently. In this case the value of a customer is spread out over a number of months and therefore we need to show both “new” and “recurring” revenue forecasts.
Also, let’s not confuse “recurring” with “people might buy again”. Think of recurring like a subscription where the product is going to be repurchased every month until it’s “turned off”, like Netflix or our phone bill.
In order to forecast our “Average Order Value” we need to estimate the average value of an order placed within a single month.
If someone buys $25 worth of hot dogs from us within the month – the average order value is $25. If they buy $1,000 worth of hot dogs throughout the year, we may adjust our forecasted “average order value” to $83 ($1,000 divided by 12 months).
Not sure what to use? That's okay, we don't have any historical data to work from, so start with the best guess and don’t worry about it. Over time as real data starts to stream in from early tests, we’ll start to shape the numbers closer to reality and get better at revenue forecasting.
Assumption 4: Recurring Revenue and Churn
In the event that our business also has a recurring element such as a subscription or monthly billing, we will also need to consider how recurring revenue will play a part in our ever-growing business.
In order to calculate how much recurring revenue we would collect from the previous month's sales, we would also need to know our “churn” number, which is the percentage of customers who will no longer continue with us the following month (they “churn out”).
Here’s an example of how we forecast recurring revenue:
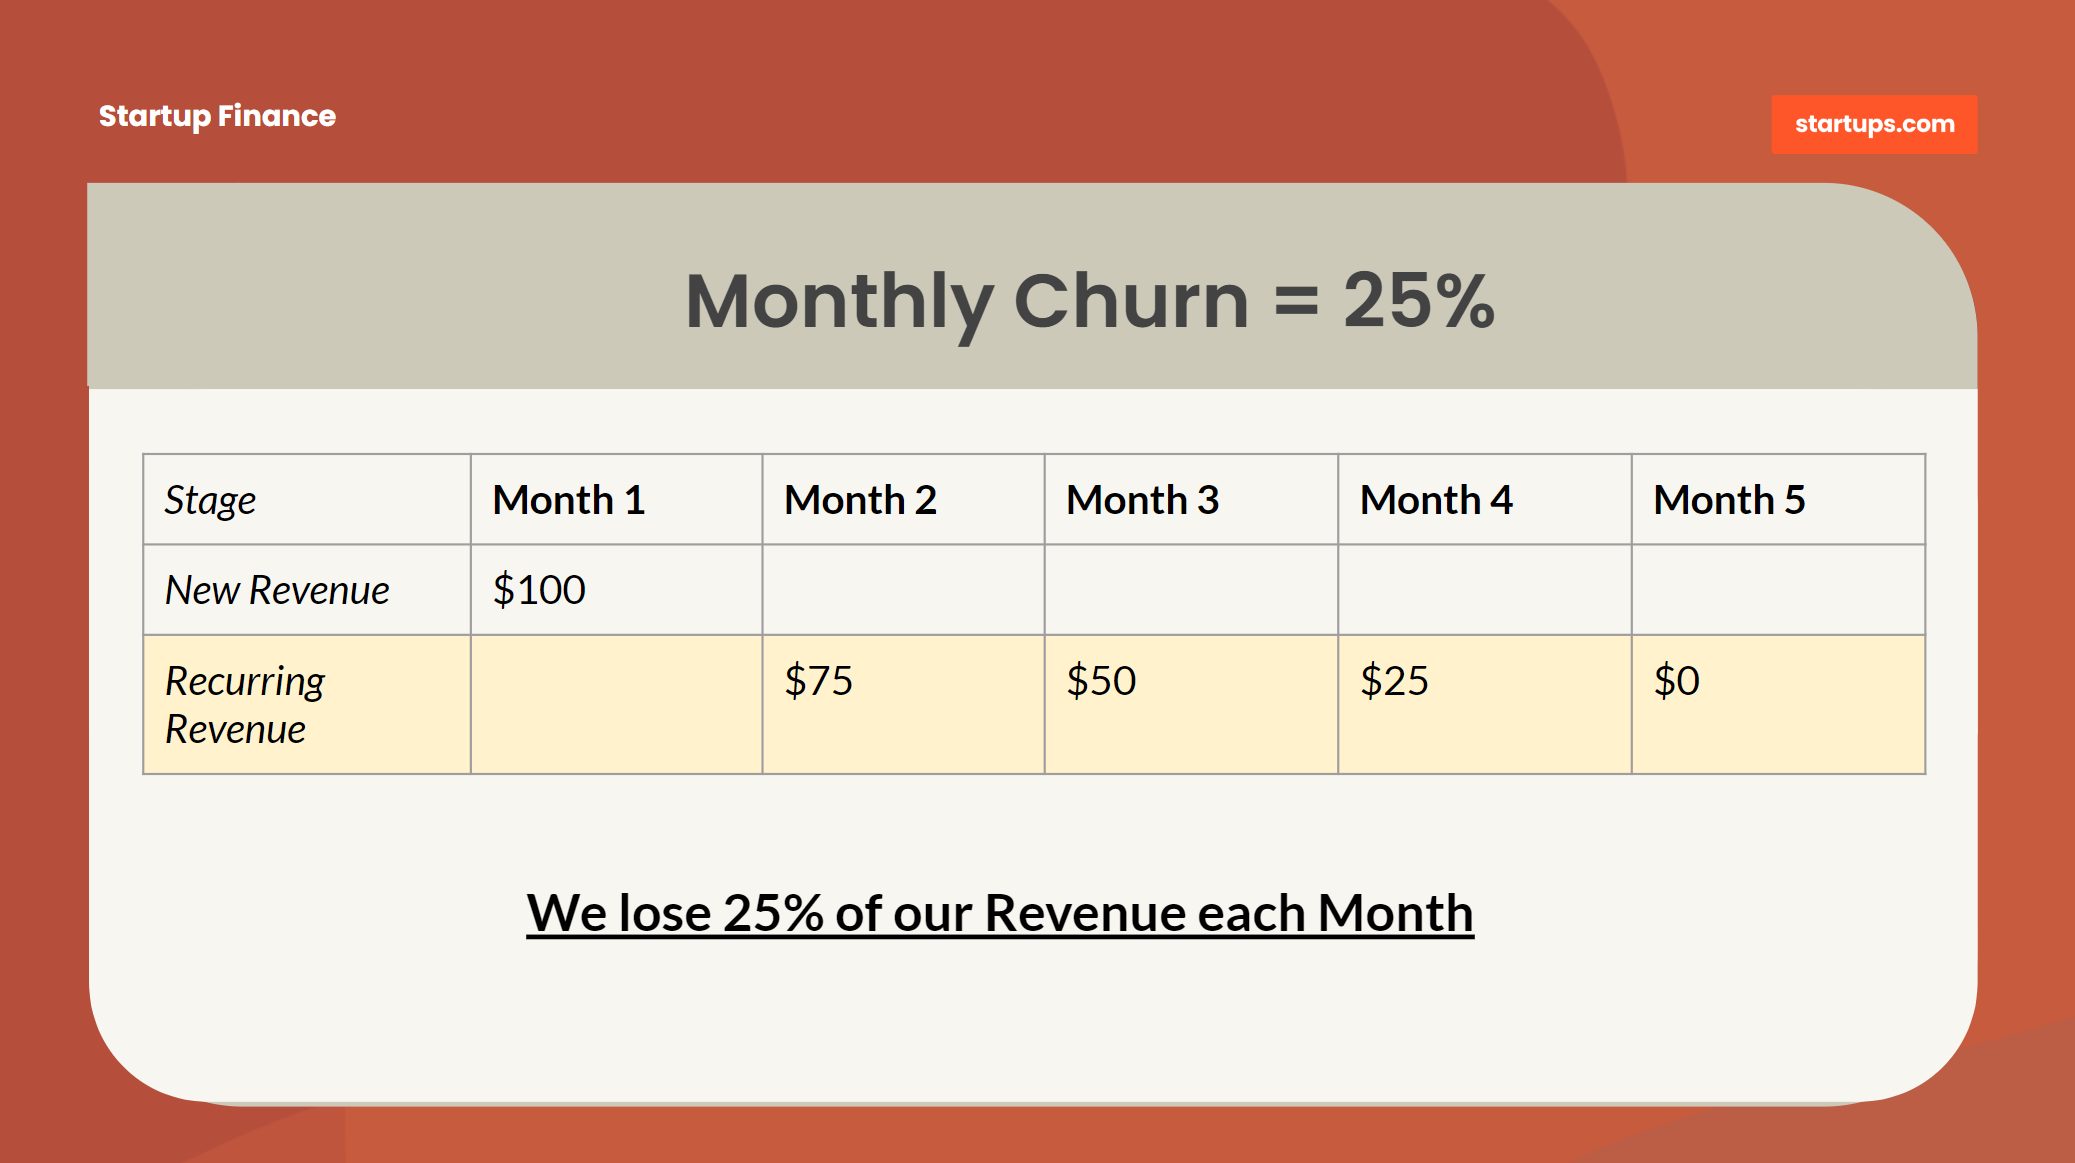
In this example in “Month 1” we had $100 of “new” revenue. Each successive month we will churn 25% of the original $100 of revenue until we reach $0 by Month 5.
In our income statement, we will want to include both “new” revenue for each month and then the sum total of all “recurring” revenue from all the prior months where we still have our original customers paying, and we watch our accounts receivable climb!
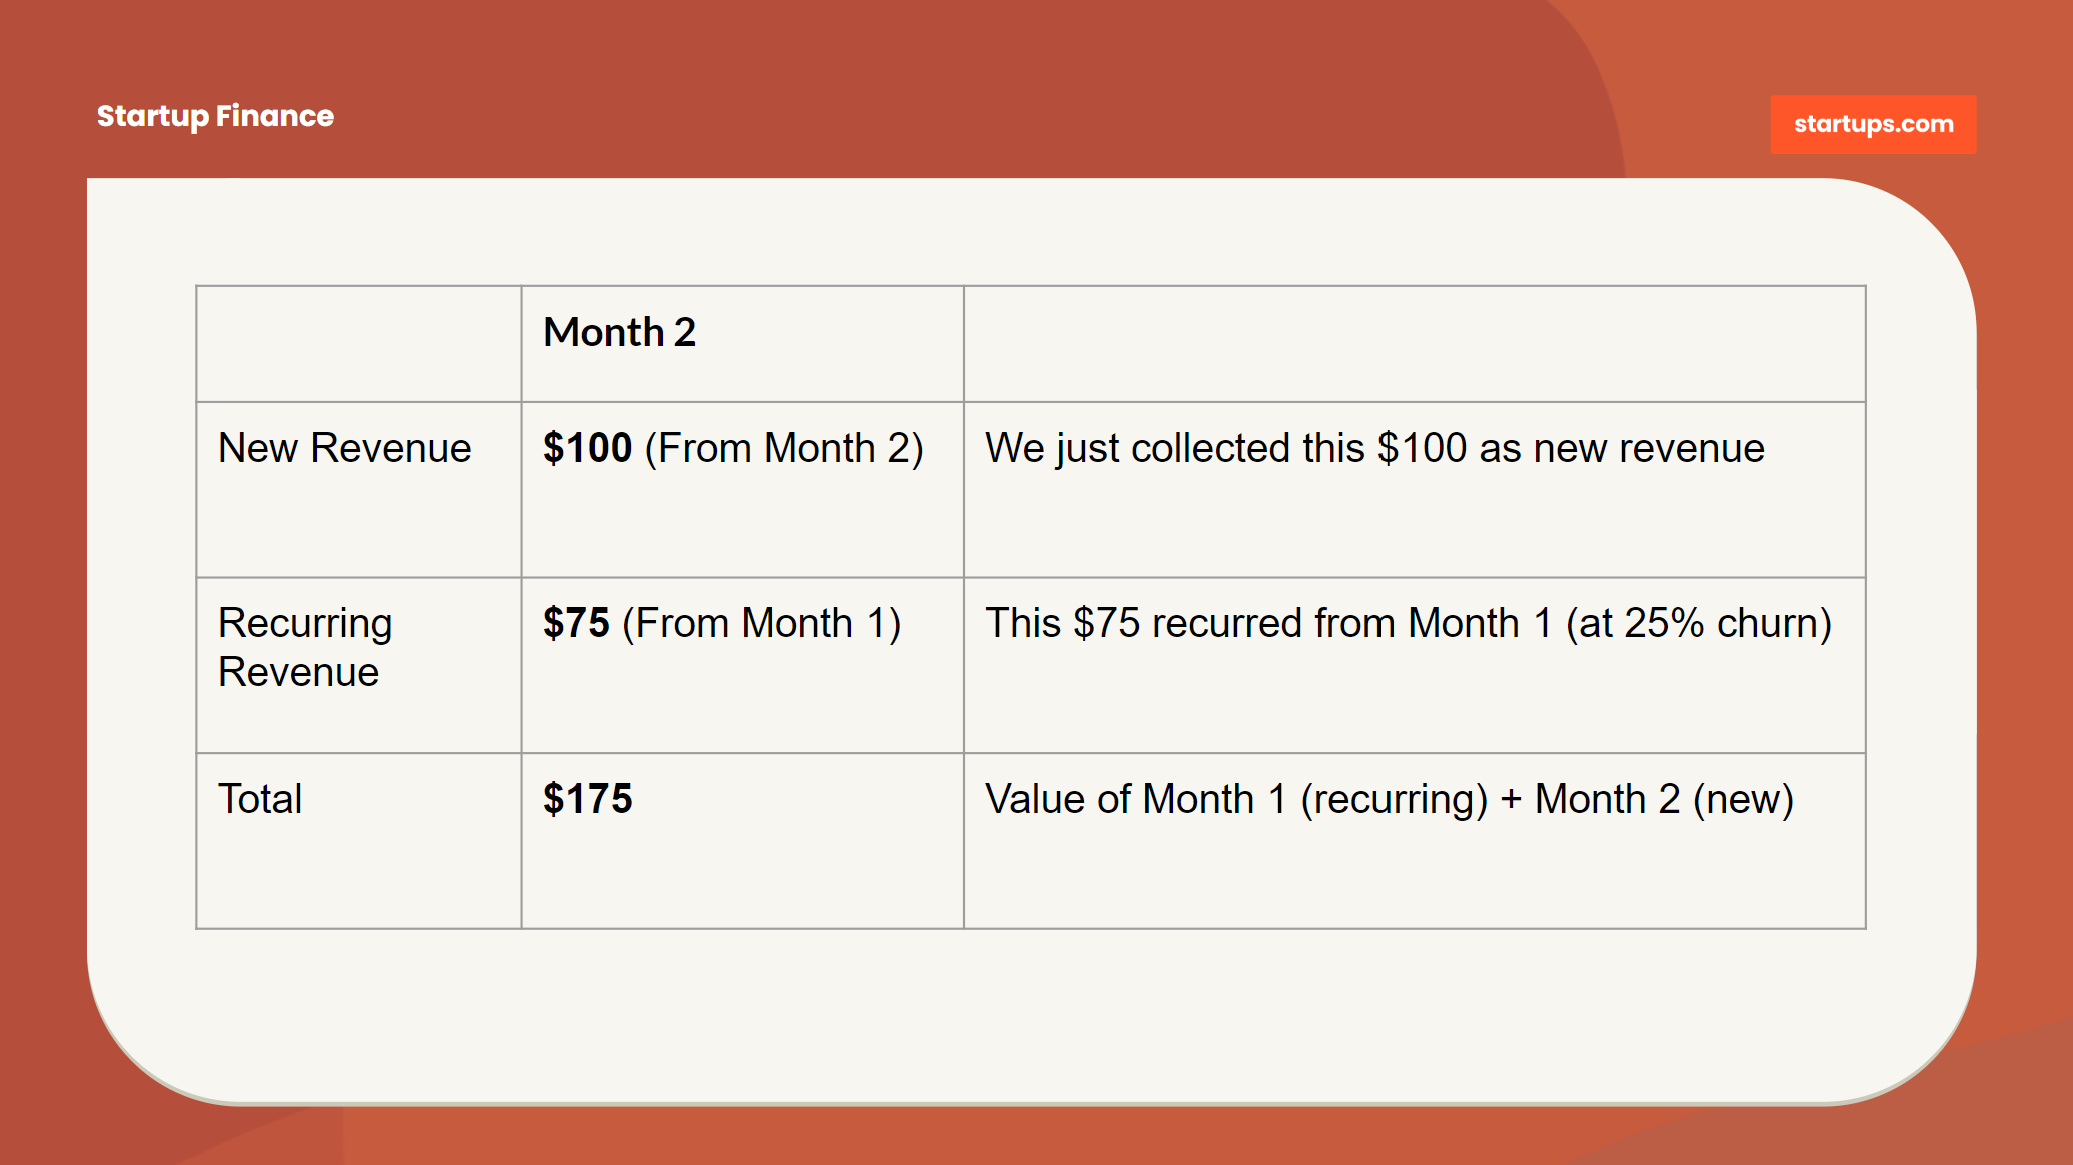
Now that just got us through how the new sales from Month 1 performed. We still need to stack that revenue on top of the “New Revenue” that we’d also generate in Month 2 which will also recur.
Here’s just a view of Month 2 to show how the stacking effect of recurring works:
Want to see even more fun with numbers (“No, Wil, I sorta don’t…”). Well, let’s look at it anyway because recurring revenues are badass.
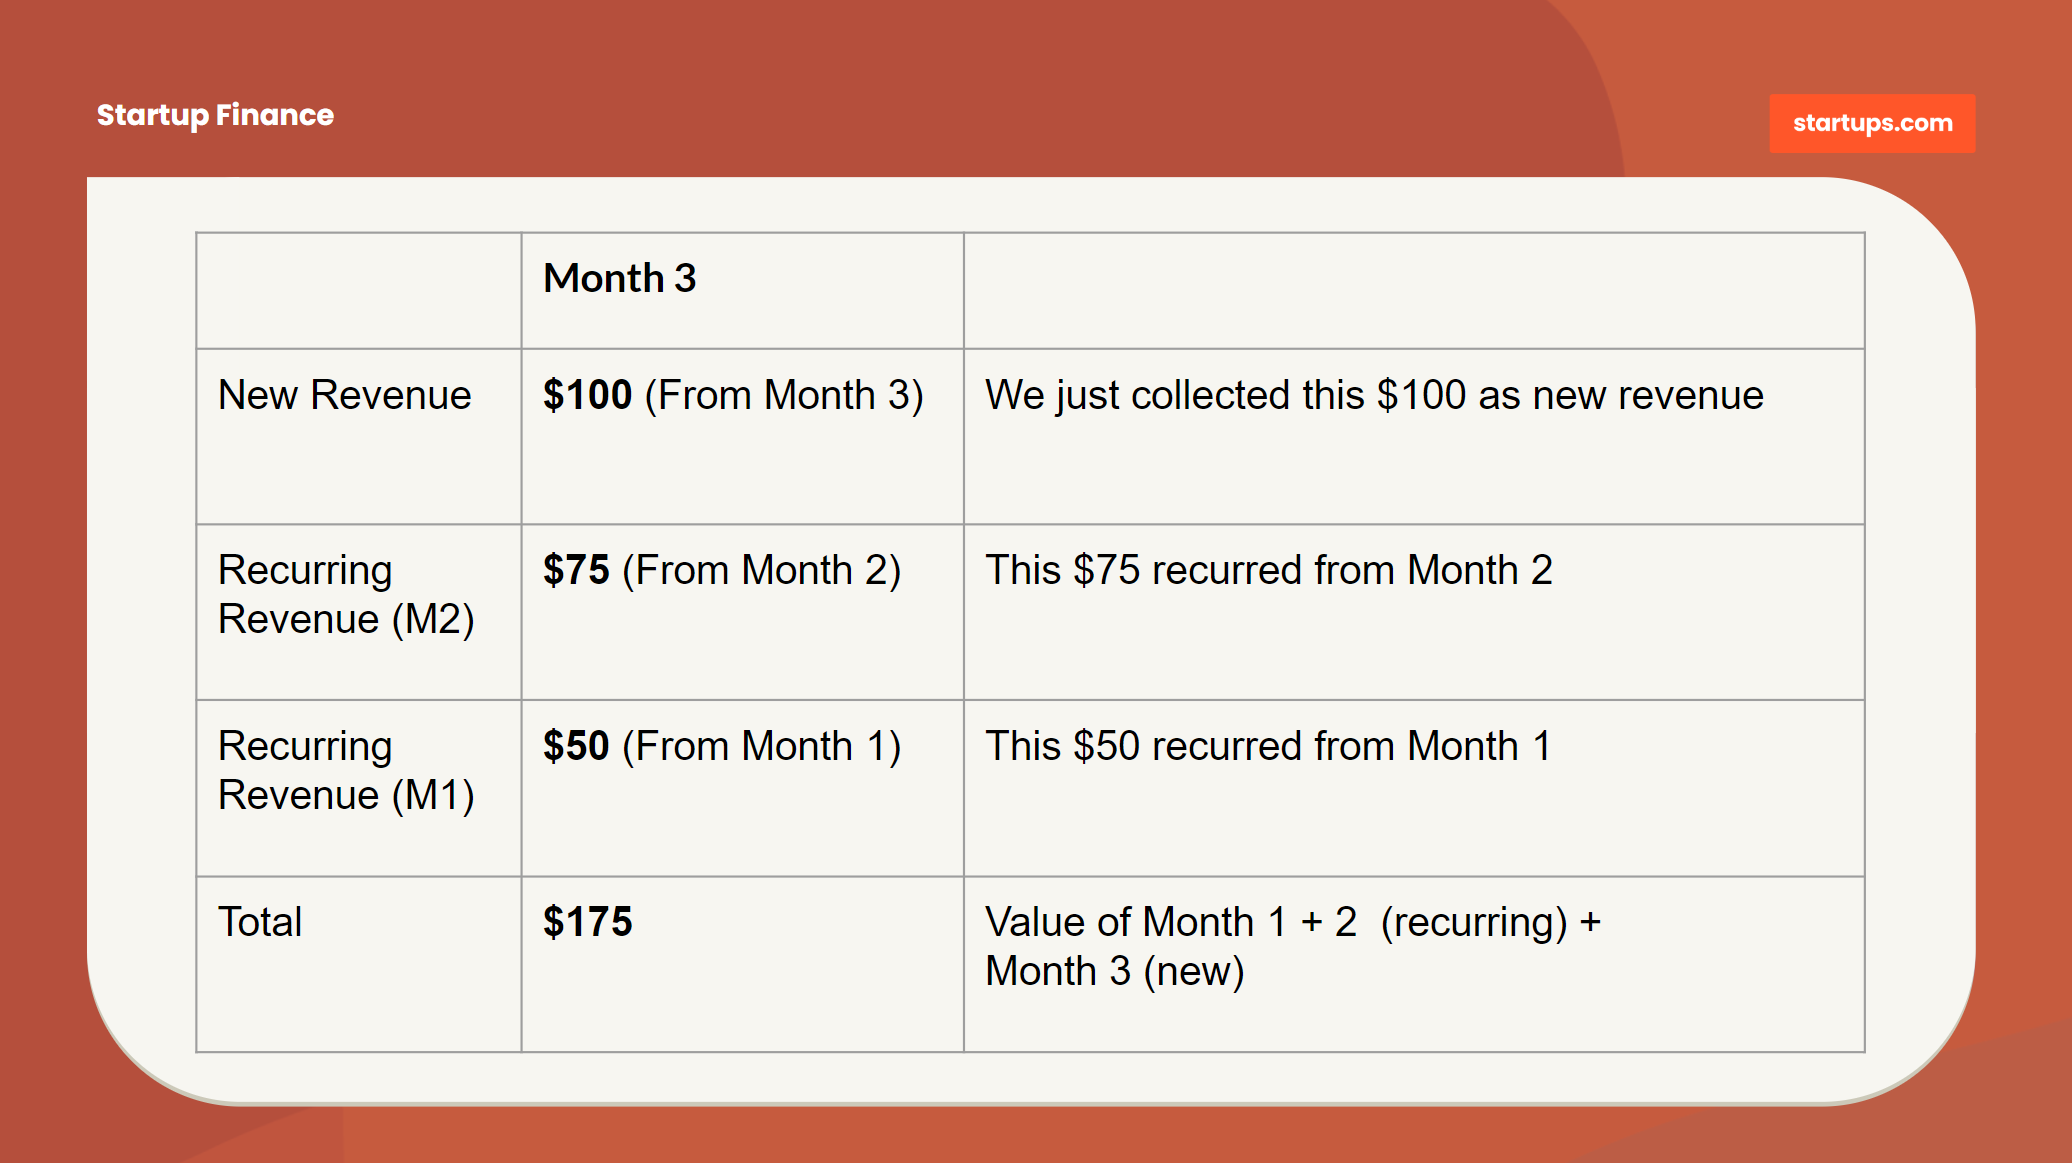
Here’s how Month 3 would stack up even more:
If this sounds like it gets into complicated math, well – it can. Fortunately, the finance nerds at Startups.com (me + team) have already done some of the heavy lifting by adding a recurring revenue forecast that automatically calculates recurring revenue for future months based on new revenue.
We can adjust our churn values each month in anticipation of improving them over time (if that’s possible) so that our recurring revenue generated from new sales improves.
The default value of “25%” is just a placeholder. That implies that a customer will be lost after 4 months. If we think our customer will stick around for 10 months, we’d use a 10% churn number.
If we’re running a subscription business, “churn” will be by far one of the most impactful assumptions in our business model, so we will always need to pay extra special attention to it.
Note that for the month of January there is no value for recurring revenue because the calculations are based on having data for “new revenue” which is only apparent in January (Month 1).
Feel free to drop in whatever recurring revenue values that are predicted for January (Month 1) in this spreadsheet.
Assumption 5: Cost of Goods Sold (COGS)
Our COGS estimates are sometimes the trickiest of all because so many businesses represent their Cost of Good Sold (or cost of sales) so differently. We’re working with a “one size fits most” spreadsheet here and we can feel free to modify it to fit our needs.
COGS are generally understood to mean the cost of delivering the actual product. If a cost exists regardless of whether we sell anything, it’s typically a fixed cost and isn’t listed here.
We’ll add our fixed expense items a bit later, and if it turns out that we realized some items are “fixed” and should be moved out of here — we can easily update that later.
We’re not so much concerned with where the items are listed initially but more so that we capture every item and work them into the right categories over time.
Before we dig in, let’s first explain that there are up to 3 options for calculating COGS:
No COGS exist. If we’re a software or Internet company, there’s a good chance our cost to deliver is irrelevant — we only have fixed expenses that don’t change much no matter how much we sell. If so, we may have some credit card fees (listed in the assumptions) or associated small costs but that’s it — and we can largely ignore COGS (but there may still be a cost of sales).
Specific Unit Costs. If we know exactly how much it will cost to sell/ship each unit (including shipping costs, and handling costs) we can enter that value which will calculate against the number of units we sell to drive our COGS. This is typically the case if we’re not manufacturing each product.
Variable Costs. If we have costs that are specific to delivery, but we have at least a minimum amount of cost to cover (such as the cost of supplies to manufacturing our product) we can use a variable cost to show that our costs will specifically escalate from order volume.
Our sample income statement works with all 3 options or a combination thereof. We may decide that we have some unit costs that are easy to isolate, like if were buying a product from a vendor as we sold it to a customer, but also some variable costs like hiring temporary staff to handle increased demand.
Credit Card Processing
Assuming we are processing orders through credit cards, we will want to capture the associated processing costs as they scale. The sample has a 3% estimate baked in for credit card processing, but our charges may vary a bit.
We can adjust that variable within the formula for “Credit Card Processing” which is calculated as 3% of the “Total Revenue” line.
Product Unit Cost
A great way to estimate COGS in relation to our forecasts for growing our business is to distill each unit sold with a specific “unit cost”. A unit cost is typically considered the total cost of delivery to the customer, not counting any fixed expenses.
If we were re-selling 8-Bit Nintendo gaming consoles, we would probably include the following costs:
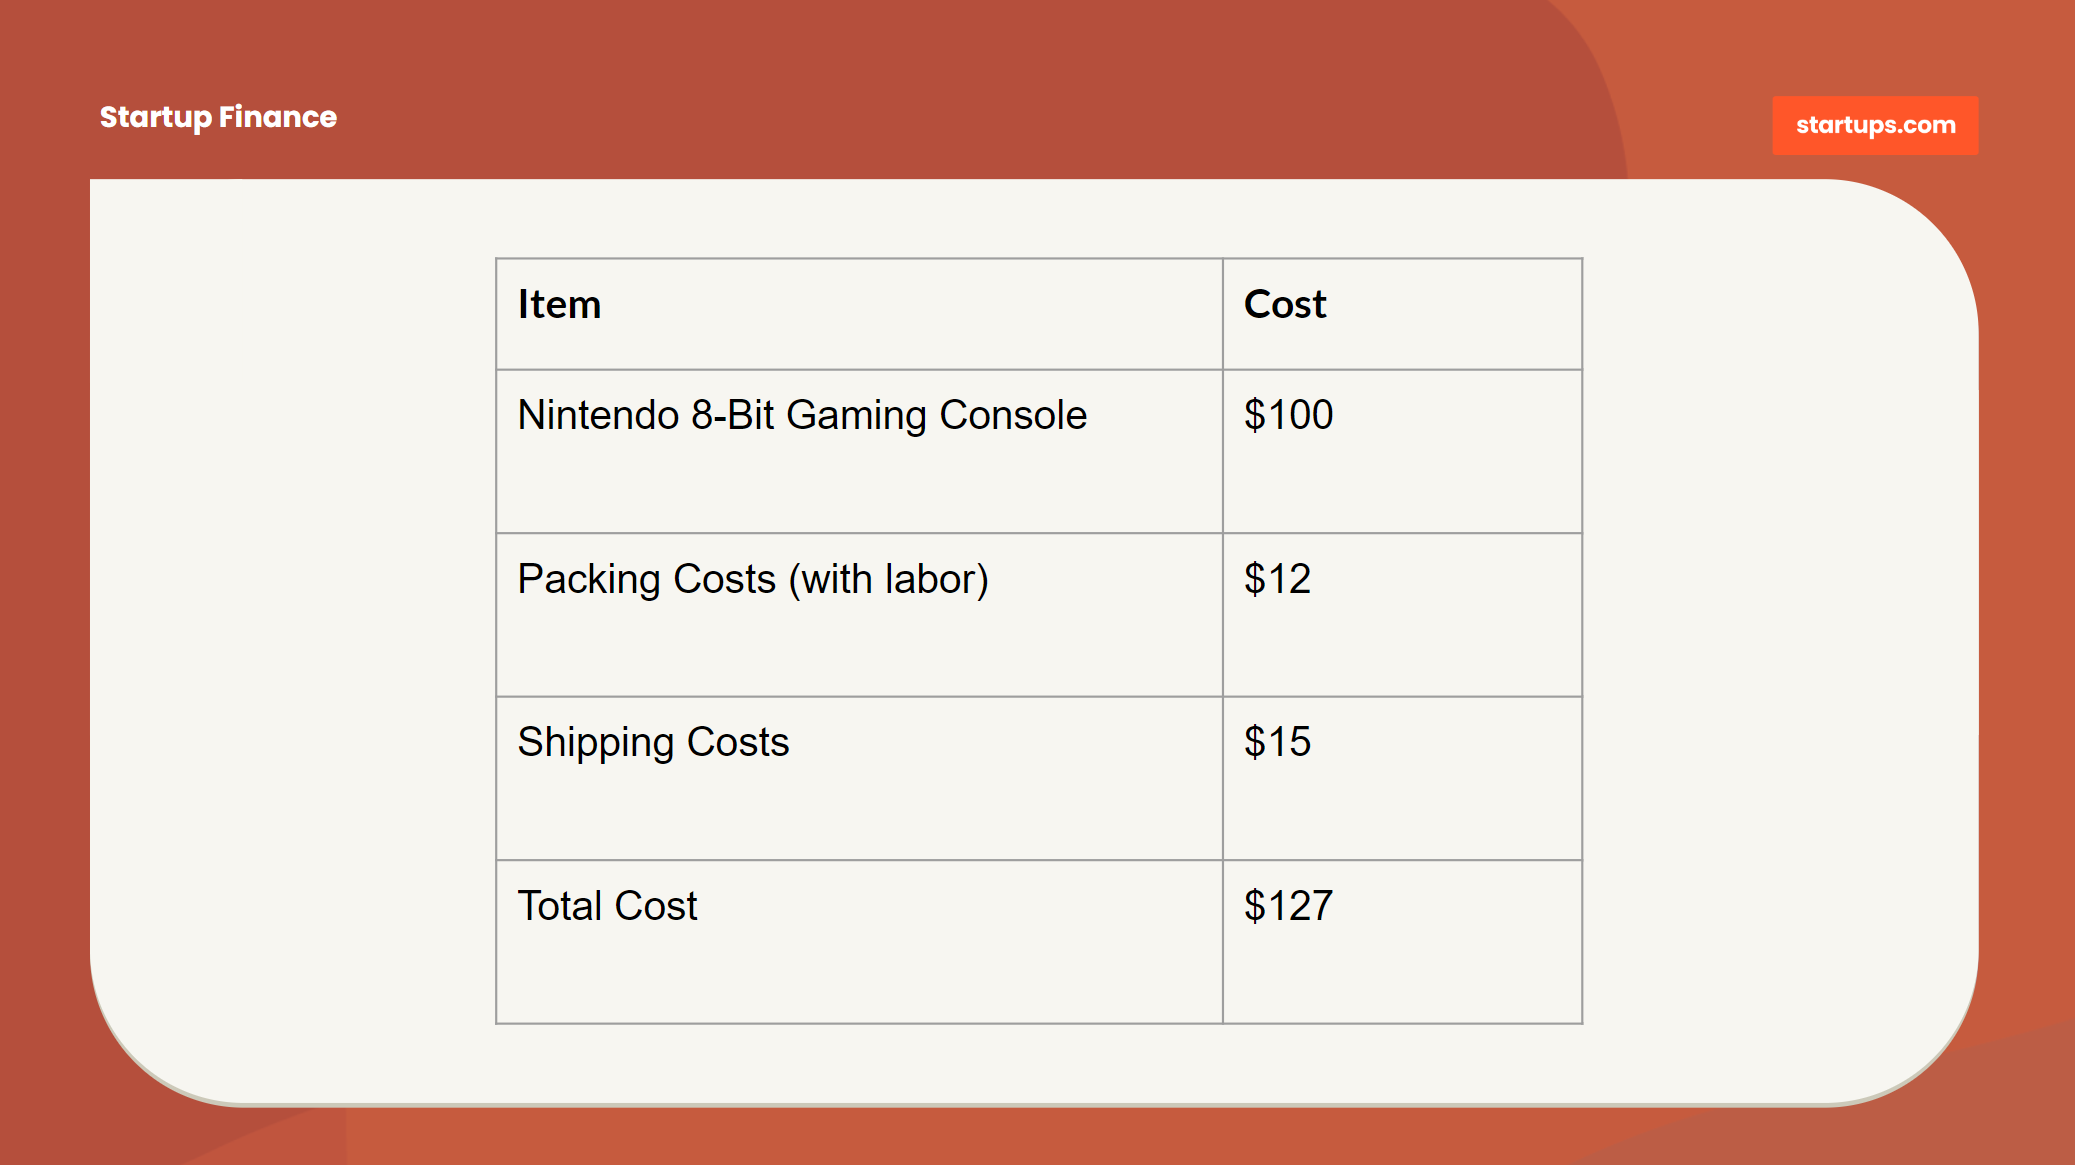
Unit costs work amazingly well when we have well-defined costs for producing a single unit for sale. In this case, we sold exactly one Nintendo unit, we bought one Nintendo unit, and we had some additional costs to pack and ship it. Easy.
Often though, our Unit Costs aren’t quite that simple. We may be purchasing materials in bulk that are intended for production into the units we are going to sell.
In that case, we can still establish a unit cost, however, we will need to divide the total cost of our materials by the total number of units those materials can generate.
If we were starting a lemonade stand, here’s how we would determine a unit cost:
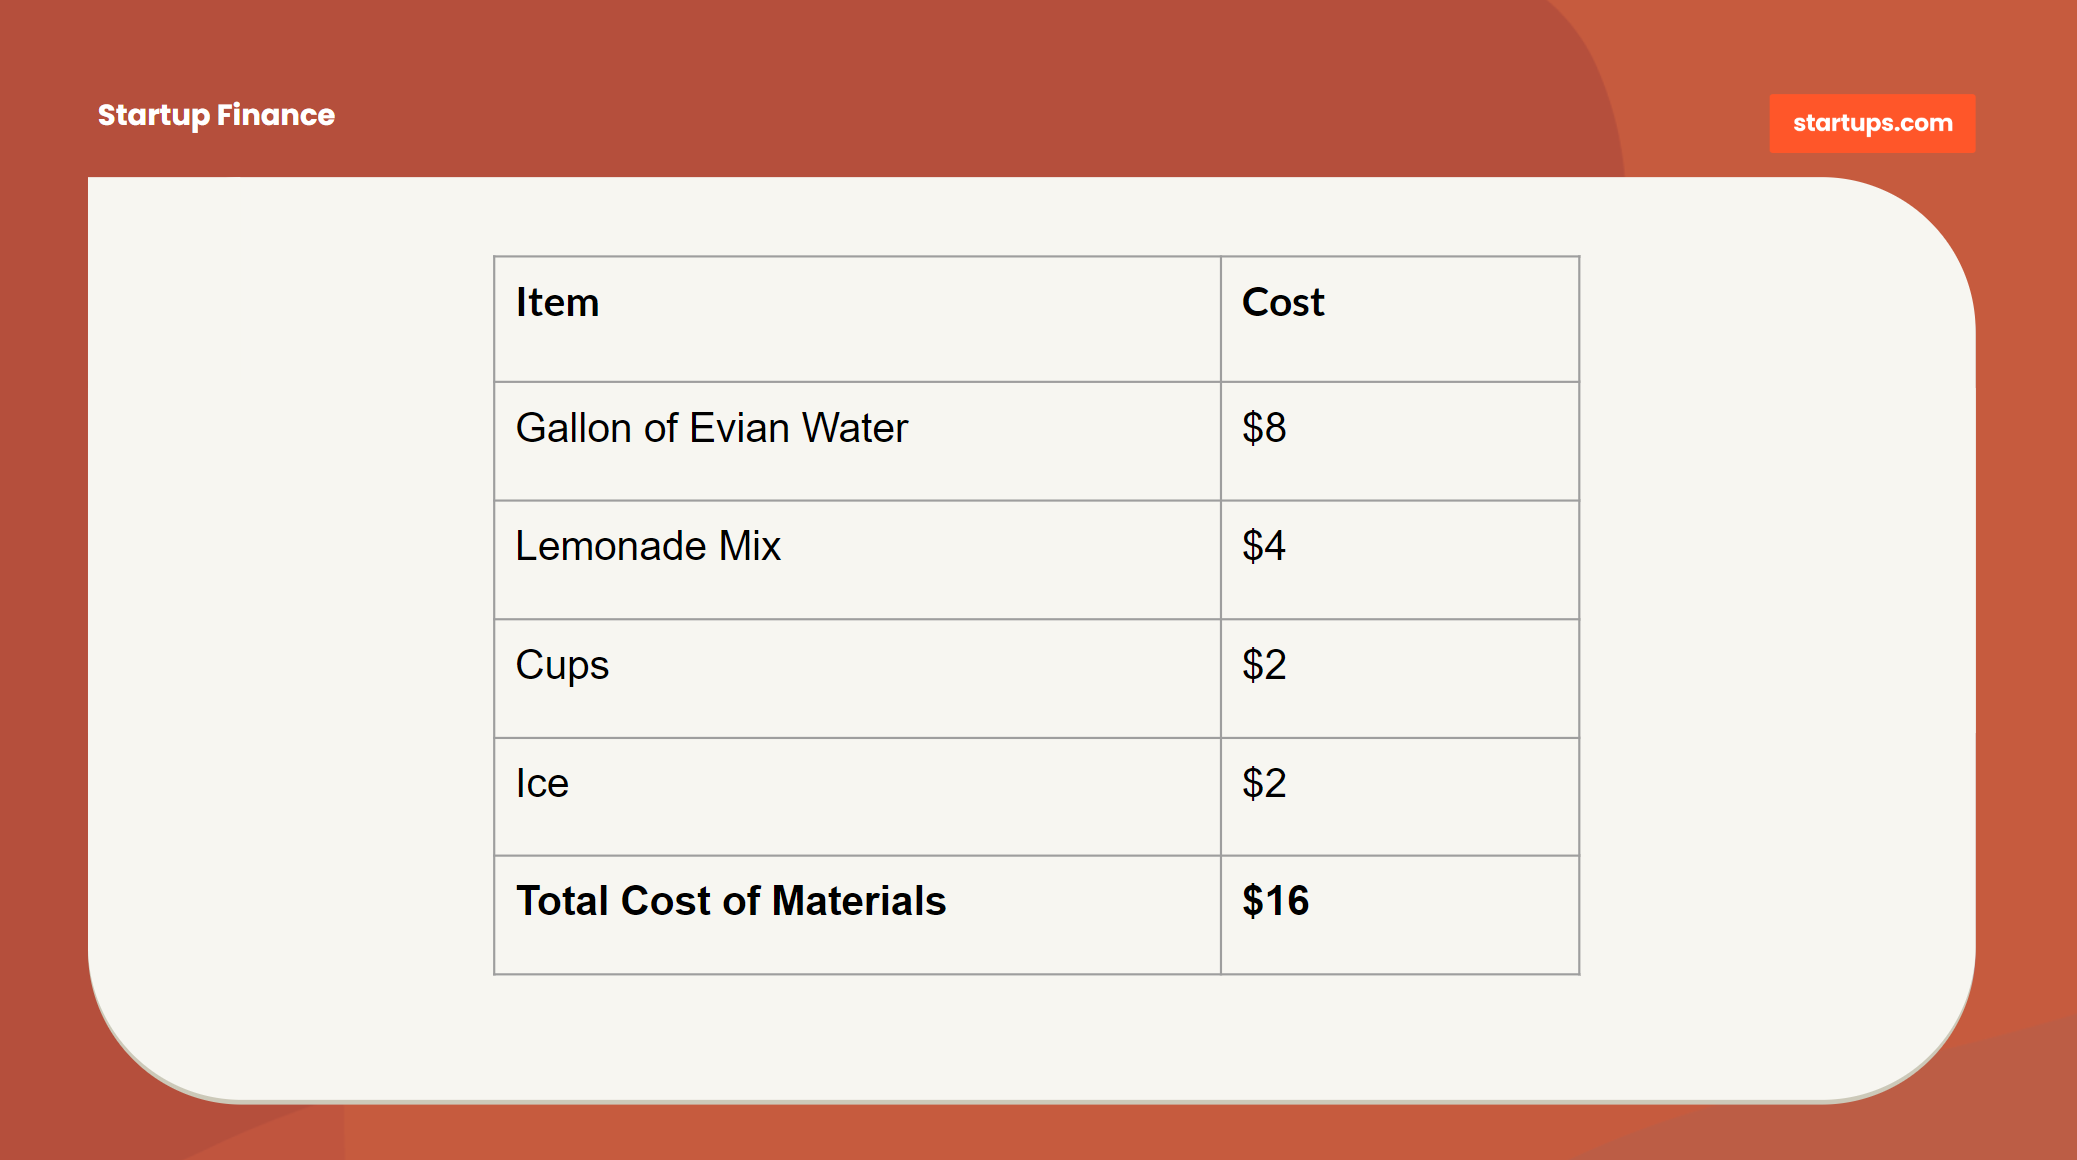
Here we have $16 in materials for our very high-end (“We only use Evian”) lemonade stand. We know that a Gallon of Evian will yield 16 cups, so our Unit Cost is $1 each. (Wow, that was a very convenient/lazy example, Wil).
Even though we may not sell all 16 units, our unit cost is still represented as $1 each. It gets more complicated if we have “spoilage” in which case we must throw out some portion of our materials which would drive the effective unit cost up due to fewer units for the same price.
But for now, let’s just use our best estimates and key assumptions to build a forecast. We can worry about the details when we get closer to the actual months.
Variable Costs
In cases where we can’t distill our sales into just Unit Costs, we may want to include Variable Costs into the mix as well. Variable costs often look and feel like “Fixed Costs” except they scale up and down based on how much product we sell.
It’s possible that we’ll “mistakenly” list some variable costs in the fixed cost areas and vice-versa. For now, don’t worry about it. We will quickly see which costs should be counted as “variable” the moment we start growing the revenue forecasts quickly.
Comparing Variable Costs vs. Fixed
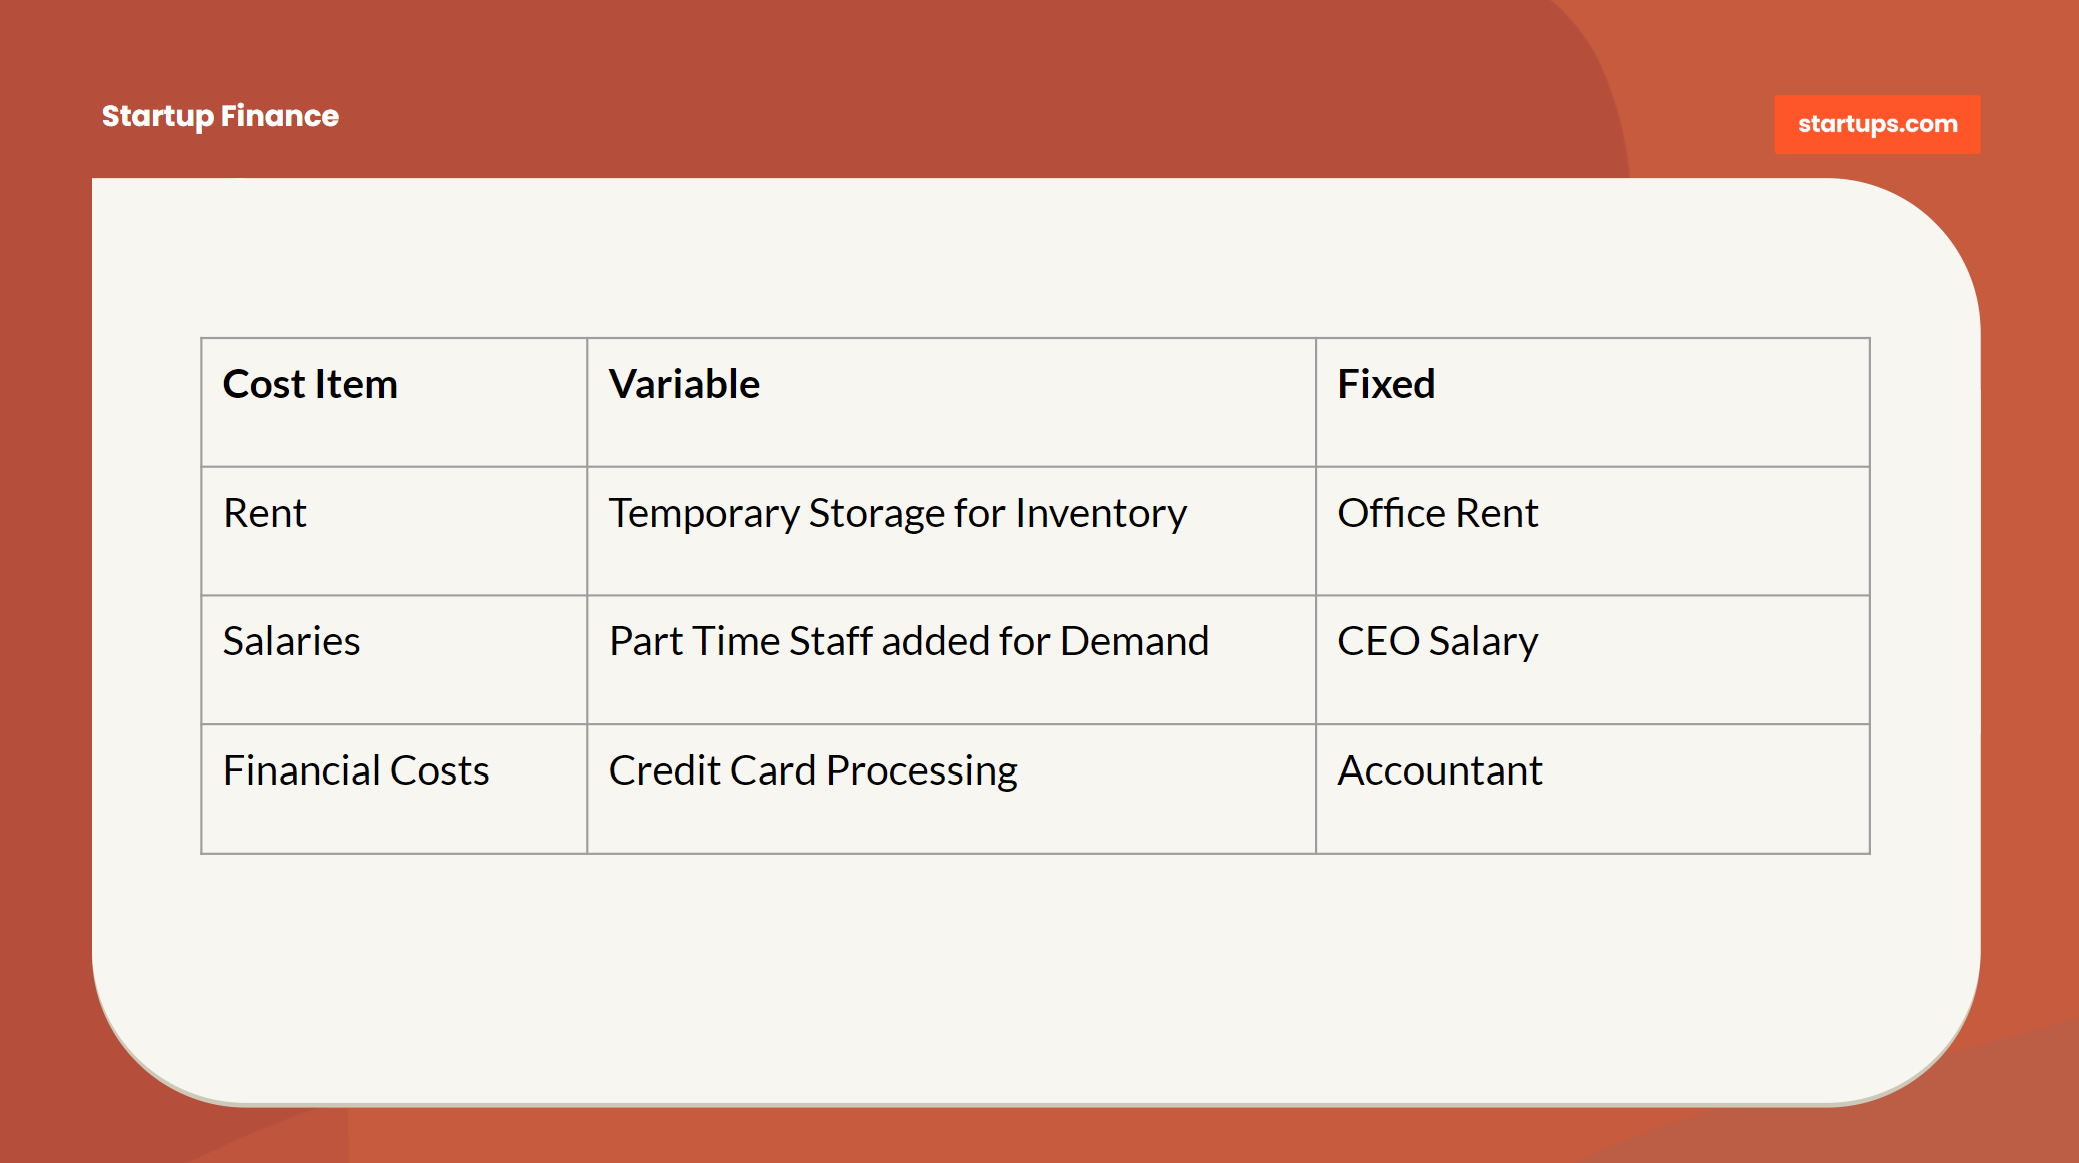
While there can be a little bit of overlap on Variable vs. Fixed costs, what matters is that we try to assign costs that scale quickly with sales to Variable Costs so that we can see where our costs will increase over time.
We can add in more rows for variable costs if we need to, but for the purposes of the Assumptions sheet, this is intended to be a summary of our costs, not a detailed listing of every cost. We can create more detail on a separate worksheet or we can use our COGS tab to capture some more detail.
Our “Total COGS” line item will combine our “credit card processing fees”, “unit costs” and any “variable costs” into a single value. We will want to watch this number very closely as it will likely be the largest variable in managing our Gross Margins, which has a direct impact on our gross profit.
Gross Margins
Once we have all our other assumptions set, our Gross Margins (GM) will automatically populate at the bottom of the Assumptions worksheet. This is the amount of income or loss we generate prior to any of the fixed operating costs of running the business.
A great way to think about GM is “If we can’t make a profit on a GM basis, no amount of cost savings or scale is going to save us!” That’s because whatever is left after GM is only ever reduced by more costs!
Gross Margin calculation explained:
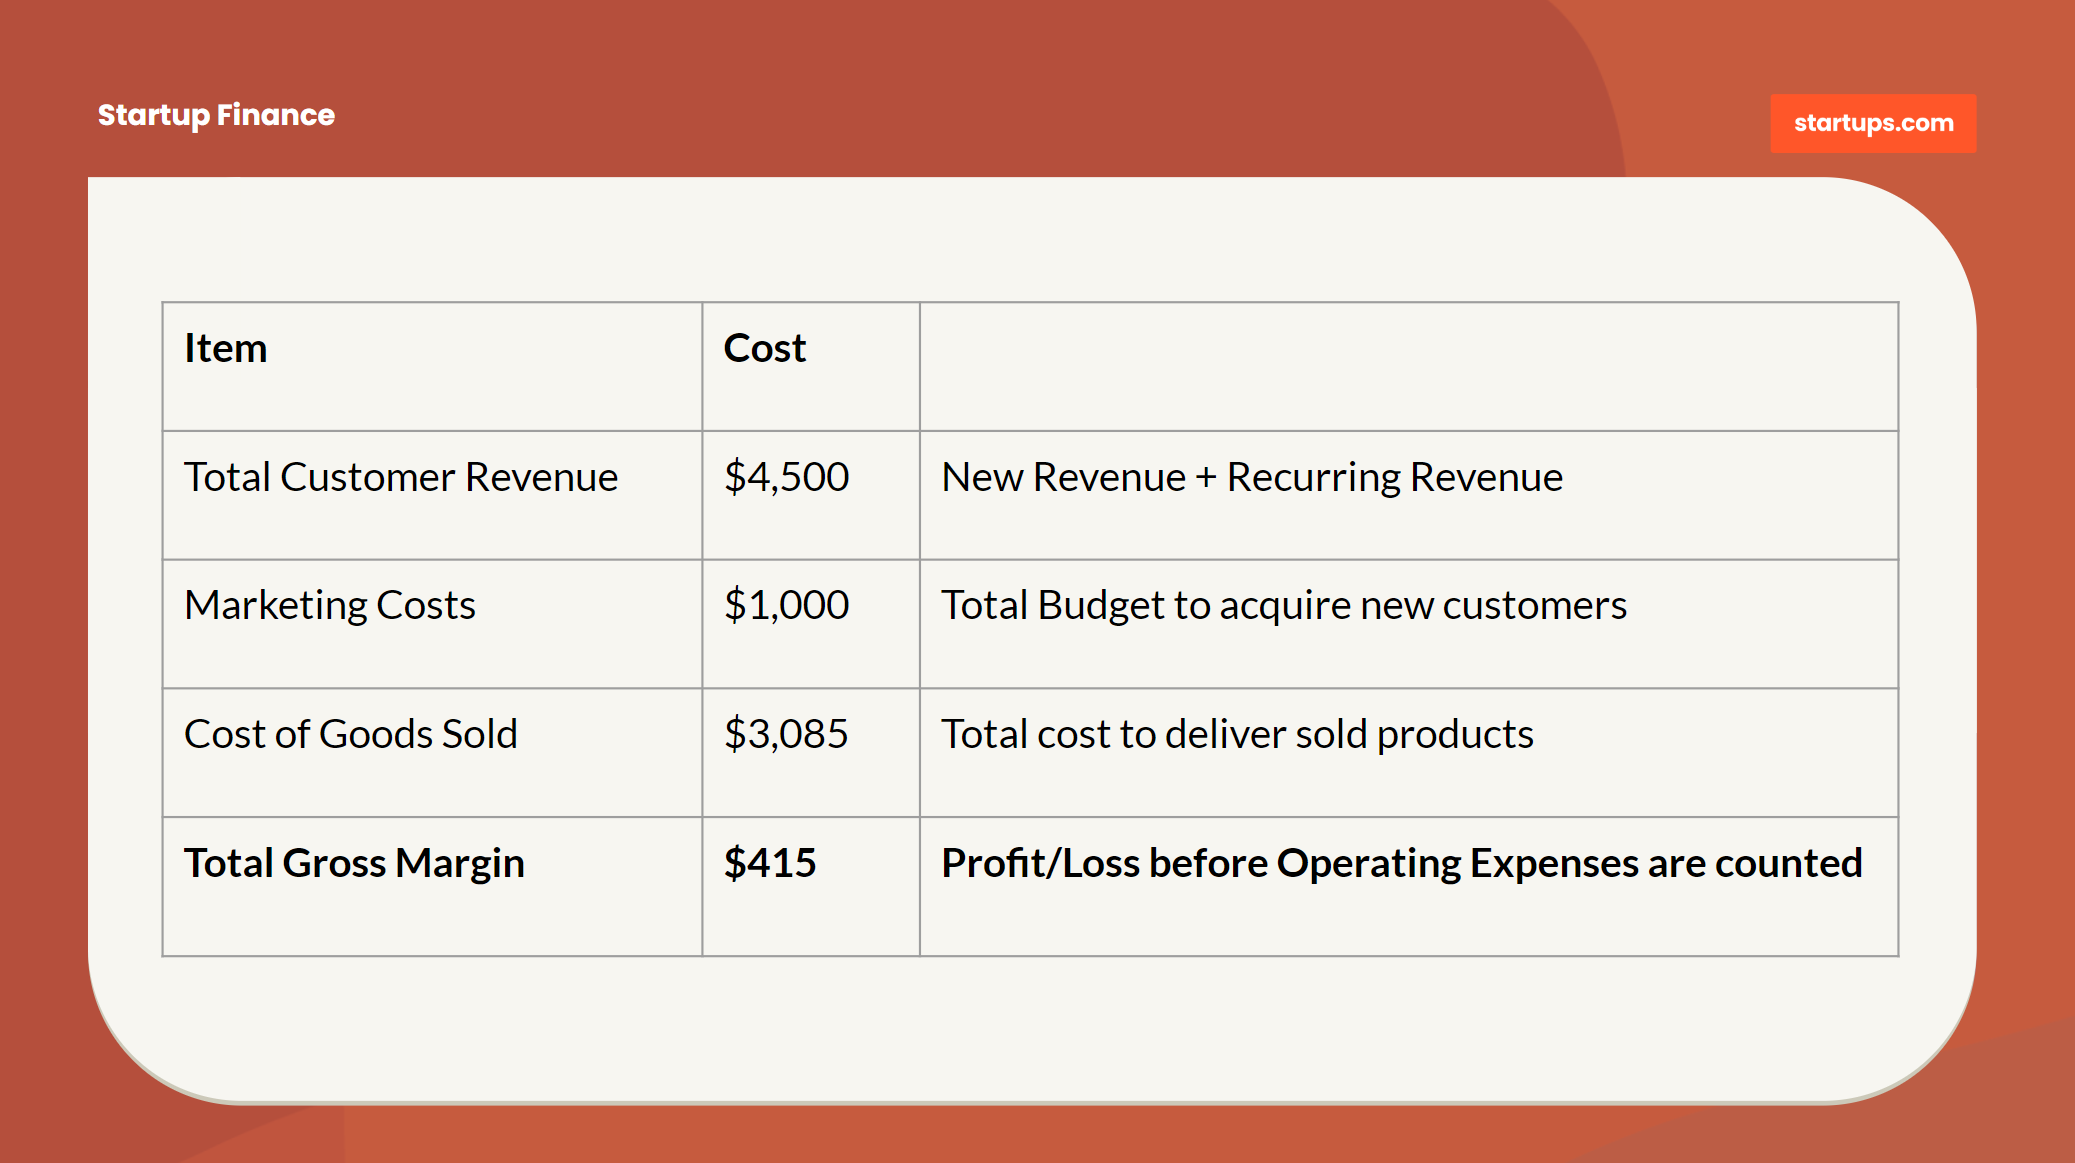
The reason we make GM visible in the Assumptions worksheet is to give us immediate visibility as to how the tiny changes we make in our assumptions will affect our gross margin.
We can see that if our “Unit Costs” increase by only a small amount or our “Conversion Rate” dips a bit, our GM will immediately be impacted to the negative.
That said, it’s pretty typical that in the formative stages of a startup GM will be negative — and that can be OK for a while.
We’re learning and making investments to start, but our goal is to turn that knowledge into a million tiny tweaks we can make in order to get our gross margin positive, which can help us toward getting our entire business profitable.
What to do Next with Our Assumptions
The Assumptions worksheet by itself is just a quick way to monkey with the key drivers in our business that will help forecast revenue or build up some historical data.
These aren’t just fake numbers though! We will use these values to help us populate the rest of our Income Statement to build out the entire forecast across all aspects of our startup.
If we’ve got a fairly good handle on the assumptions, the next step is to begin populating the Fixed Cost items in our projections.
About the Author
Wil Schroter
Wil Schroter is the Founder + CEO @ Startups.com, a startup platform that includes Bizplan, Clarity, Fundable, Launchrock, and Zirtual. He started his first company at age 19 which grew to over $700 million in billings within 5 years (despite his involvement). After that he launched 8 more companies, the last 3 venture backed, to refine his learning of what not to do. He's a seasoned expert at starting companies and a total amateur at everything else.
Related Articles
Unlock Startups Unlimited
Access 20,000+ Startup Experts, 650+ masterclass videos, 1,000+ in-depth guides, and all the software tools you need to launch and grow quickly.
Already a member? Sign in